> For the complete documentation index, see [llms.txt](https://aisviz.gitbook.io/documentation/llms.txt). Markdown versions of documentation pages are available by appending `.md` to page URLs; this page is available as [Markdown](https://aisviz.gitbook.io/documentation/machine-learning/a-no-code-interface.md).
# A No-Code Interface
Preprocess, discretize, and enrich AIS tracks through a point-and-click Gradio app, with built-in plotting and a Gemini assistant, no Python script required.
Every earlier page in this section assumes you are comfortable calling AISdb from a script. This page removes that requirement. You launch a single Gradio app that wraps the same track-generation, discretization, and enrichment functions used throughout this guide, then clean a CSV of AIS positions, add H3 grid cells, layer in bathymetry and weather, plot the result, and question it with a Gemini assistant, all from a browser tab.
## What you will learn
* Launch the AISdb no-code app and load your own AIS CSV
* Chain preprocessing steps (time splits, encoding, H3 discretization, stop detection) from a checklist
* Enrich tracks with bathymetry and weather context
* Export static and interactive maps, and ask a Gemini model about the loaded data
## Prerequisites
```bash
pip install aisdb gradio pandas numpy rasterio plotly matplotlib cartopy h3 langchain-google-genai google-generativeai
```
The app works on any CSV with the usual AIS columns. For a sample that matches the rest of this section, decode the NOAA day file [`AIS_2020_01_01.zip`](https://coast.noaa.gov/htdata/CMSP/AISDataHandler/2020/AIS_2020_01_01.zip) with `aisdb.decode_msgs` and export a CSV as shown in [AIS Data to CSV](/documentation/tutorials/ais-data-to-csv.md).
The H3 step relies on the `aisdb.discretize` module, which landed after the 1.8.0-alpha release, so install AISdb from the development branch (`pip install git+https://github.com/MAPS-Lab/AISdb.git`) if you want that step to work. The two chat tabs need `langchain-google-genai` and `google-generativeai`; without them, those tabs report that the SDK is missing instead of failing the whole app.
## 1. Download and launch the app
The interface is one Python script built on [Gradio](https://www.gradio.app/) rather than a packaged AISdb module. Download it, export your Gemini key (only needed for the chat tabs), and run it.
{% file src="/files/f258peLwluqwjl7QDnwb" %}
```bash
export GOOGLE_API_KEY="your-key-here"
python ais_bot.py
```
The script starts a local Gradio server on port 7860. Open `http://localhost:7860` in a browser to reach the interface.
## 2. Load a CSV
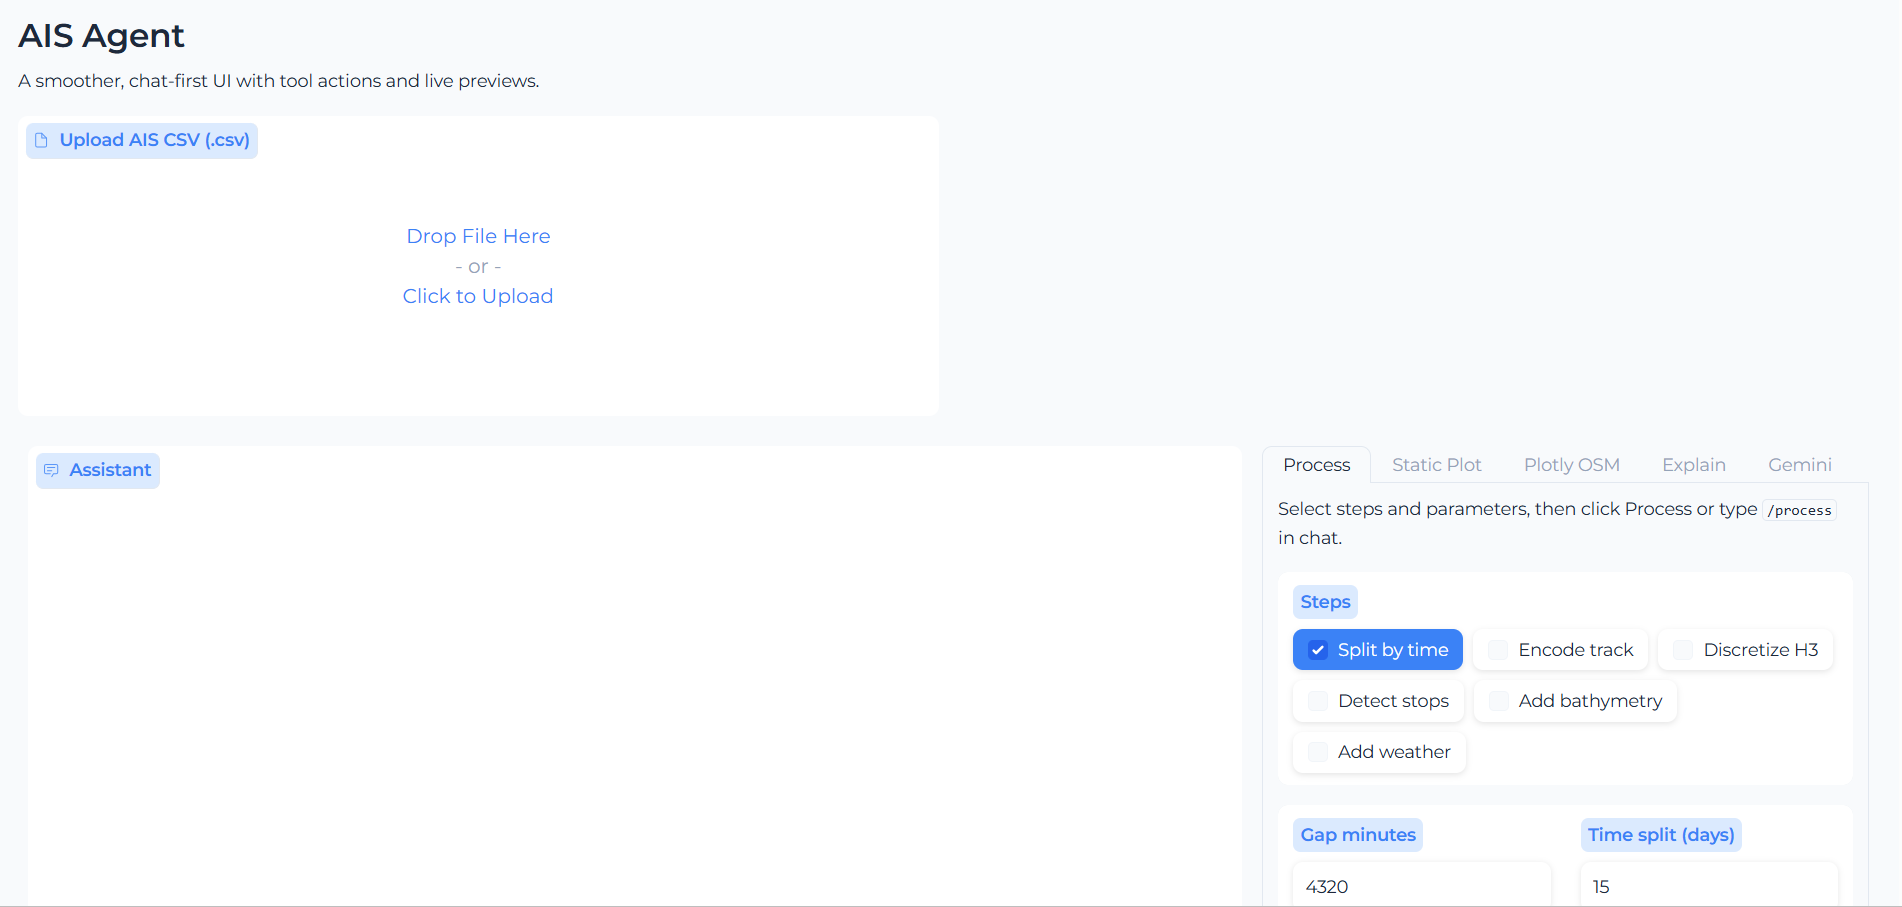
Drag and drop your CSV onto the landing page. The app reports the total row count and summary statistics for the numeric columns, which is a quick sanity check that the file parsed the way you expected before you spend time processing it.
The landing page after a CSV upload, showing the automatic row count and per-column summary for the loaded dataset.
## 3. Chain preprocessing steps
The Process tab is a checklist, and the app runs whatever you tick in order. These are the same functions (`split_timedelta`, `encode_greatcircledistance`, `Discretizer`, `WeatherDataStore`) you would otherwise call from a notebook.
1. `Split by time` breaks continuous tracks into segments at significant time gaps.
2. `Encode track` applies distance and speed thresholds to smooth and segment trajectories.
3. `Discretize H3` converts coordinates into H3 hexagonal grid cells for spatial analysis.
4. `Detect stops` finds stopping periods from speed and duration thresholds.
5. `Add bathymetry` samples water depth along each track from a GeoTIFF.
6. `Add weather` joins weather parameters (wind, pressure, and so on) onto the tracks.
Each step exposes its parameters in the panel below the checklist.
* `Gap minutes` (default 4320) is the maximum time gap between points before a new segment starts.
* `Time split (days)` (default 15) caps the maximum duration of a segment.
* `Encode distance (m)` (default 200000) and `Encode speed (knots)` (default 50) are the thresholds for track encoding.
* `H3 resolution` (default 6) sets the hexagon size, from 0 to 15; higher values mean smaller cells.
* `Bathymetry raster` points at the depth GeoTIFF; `Weather shortnames` lists parameters such as `10u,10v,msl`.
* `Distance split (m)` (default 30000) and `Speed split (knots)` (default 30) control the segmentation thresholds.
## 4. Plot the processed tracks
Two tabs render whatever the pipeline produced. Static Plot draws the tracks with Matplotlib and an optional Cartopy coastline, exporting PNG or PDF for a paper or report. Plotly OSM draws the same tracks on an OpenStreetMap layer you can zoom, pan, and hover, and exports a standalone HTML file to share.
## 5. Ask questions about the data
The Explain tab forwards your question plus a summary of the loaded dataset to a Gemini model through LangChain and returns a plain-text answer, useful for row counts, gaps, or a quick read on a particular MMSI. The Gemini tab goes further and also sends along the plot you generated, so the model reasons about the image and the data together. Both need `GOOGLE_API_KEY` set, and both sit in the same territory as the [RAG chatbot](/documentation/machine-learning/building-a-rag-chatbot.md), except here the model reasons over your uploaded data rather than the documentation.
## Results
The screenshot in step 2 is what a successful session looks like at the start. From there, a typical pass on the NOAA sample takes a few clicks, tick `Split by time` and `Encode track`, run, then switch to Static Plot for a publication figure or Plotly OSM for interactive inspection, and export.
## Takeaway
* One Gradio script exposes AISdb's preprocessing pipeline to people who never touch Python.
* Everything runs in memory on one uploaded file, right for exploring a day or a region, wrong for a multi-year database.
* Nothing persists between sessions, so export anything you want to keep before closing the tab.
* Treat the app as a fast way to inspect and enrich a sample before committing the same steps to a reproducible script.
To turn what the app does into code you can version and scale, start back at [Clustering with Scikit Learn](/documentation/machine-learning/clustering-with-scikit-learn.md), the first page of this section.
## References
* Gradio:
* AISdb source and documentation:
* H3 hierarchical hexagonal geospatial indexing system:
* Google Generative AI Python SDK:
---
# Agent Instructions
This documentation is published with GitBook. GitBook is the documentation platform designed so that both humans and AI agents can read, navigate, and reason over technical content effectively. Learn more at gitbook.com.
## Querying This Documentation
If you need additional information that is not directly available in this page, you can query the documentation by asking a question.
Perform an HTTP GET request on the following URL with the `ask` and `goal` query parameters:
```
GET https://aisviz.gitbook.io/documentation/machine-learning/a-no-code-interface.md?ask=&goal=
```
`ask` is the immediate question: it should be specific, self-contained, and written in natural language.
`goal` is what the user is ultimately trying to achieve, the reason they need the answer. Sharing it helps GitBook give you a better, more relevant answer. A goal is most helpful when it describes the outcome the user wants rather than restating the question. For example, with `ask=how do I create an API token`, a goal like `automate deployments from our CI pipeline` lets GitBook tailor the answer to that use case.
The response will contain a direct answer to the question and relevant excerpts and sources from the documentation.
Use this mechanism when the answer is not explicitly present in the current page, you need clarification or additional context, or you want to retrieve related documentation sections.